In this activity, you are going to:
Create a new project by making an API call to pull in data and parse the resulting JSON
Manipulate the data by using GREL date expressions and facet the data to make discoveries
Create a new project by making an API call to pull in data and parse the resulting JSON
1. We are going to use an API from the City of Toronto to gain access to some data they have on their 311 calls (i.e., city service requests regarding pot holes and graffiti). Go to the open.toronto.ca website and click on the Explore the Catalogue button.
2. Search for 311 and click on the item 311 – Open311 API Calls for Service Requests.

This next page describes the dataset. At the bottom is some documentation on how to use the API. Under the Download data section, download and open up the first link to a MS Word document, open311api-get-service-requests-readme.

You should see that it describes how to construct the API call and provides some examples. The code for the data we will be using, Sidewalk – graffiti, is CSROSC-14, so let's use that to get only those service requests. Following the example, our API call would be
https://secure.toronto.ca/webwizard/ws/requests.json?service_code=CSROSC-14&jurisdiction_id=toronto.ca
3. Open up a new tab on your browser and copy this URL into it. You should see a hard to read screen full of data in JSON format. We are going to use OpenRefine to help us make sense of this.

4. Let’s create a new project. Start up OpenRefine (if it isn’t running) or click on the OpenRefine logo on the top left to go to the main screen.
5. Click on Create Project. Select to get the data from Web Addresses (URLs). Copy in the URL we just created (see above) and click on Next.

(Or, if the 311 Calls API service isn't working, select This Computer and load the 311dataset.json.)
6. OpenRefine has recognized the data as JSON, but it needs our help to make sense of which curly brackets contain individual records. We need to click on the JSON preview to highlight what a complete record is within the curly brackets. Hover over the curly bracket just below service_requests at the top of the file. That should highlight a few lines of code that pertain to a record. You'll see that the next record contained in curly brackets is for a different location. What you hovered over is an example record, so click on it (i.e., click on the curly bracket just below service_requests).

7. You should be brought to a preview screen that shows you all the records in the file, nicely laid out with rows and columns. If it looks readable, then OpenRefine has correctly parsed the JSON file. If you're happy with the results, give your project a name at the top and click on Create Project. As you can see, OpenRefine has helped you process and understand the JSON resulting from the API call.
Manipulate the data by using GREL date expressions and facet the data to make discoveries
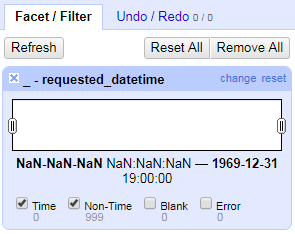
8. Now let's use this data to take a closer look at manipulating dates. One of the columns in our dataset is called requested_datetime. We can use this column to tell us more about when requests came in for this type of complaint. From the requested_datetime column pull down menu, select Facet > Timeline facet. You'll see that OpenRefine doesn't realize that this column represents dates and times. But we can fix this.

From the requested_datetime column pull down menu, select Edit cells > Common transforms > To date. Now we should be able to see the time line facets and use the handles to narrow down what rows we display. Give it a try to display requests made between two particular dates.


Once you’re done, close the facet window by clicking on the x.
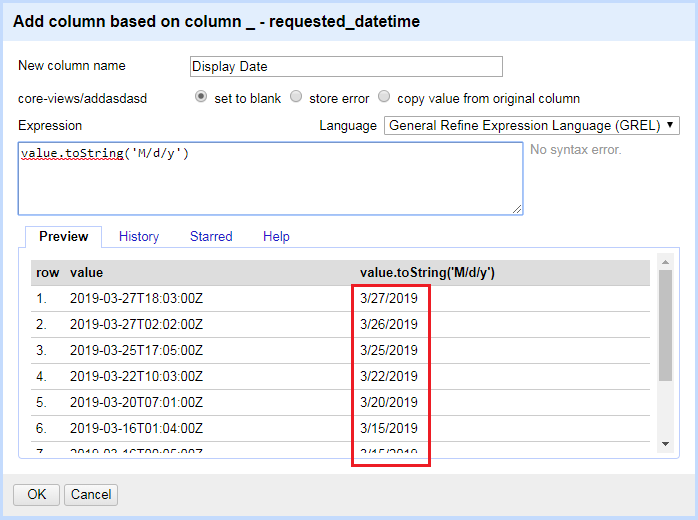
9. This column is hard to read, so let's create a new column with a simplified date displayed. From the requested_datetime column pull down menu, select Edit columns > Add column based on this column. Give your column the name Display Date. Then we can use a GREL expression to take this date and put it in a customized date format, such as m/d/y. For the expression, type:
value.toString('M/d/y')Remember, the preview window will let you see if your expression is working the way you want it to. Then click on OK.

10. Another thing we can do with our requested_datetime field is pull out parts of the date to create facets. For example, let's parse the date to find the most popular month of the year for these types of requests. From the requested_datetime column pull down menu, select Edit columns > Add column based on this column. Give your column the name "Month". For the expression, type:
value.datePart("month")Click on OK.

11. Let's change it to write out the month names. First right now they are being considered numbers, but we need to change them to text in order to do our transformation. From the Month column pull down menu, select Edit cells > Common transforms > To text.

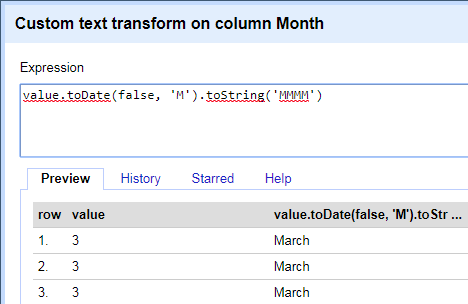
Then from the Month column pull down menu, select Edit cells > Transform. For the expression, type:
value.toDate(false, 'M').toString('MMMM')This tells it to take the text, consider it the month part of a date, but then write it out with its long name format. The false part is to say that our date doesn’t start with the day first. Click OK.

12. Finally, let’s see which is the most popular month. From the Month column pull down menu, select Facet > Text facet. In the facet window, click on Sort by > count to sort the facets and see which month comes out on top.

That’s it for our 311 calls dataset!