Before you begin, make sure you have MAXQDA installed. If you don’t, you can consult our tutorial on the ways you can access MAXQDA.
You’ll also need to download some datasets that we’ve provided for this tutorial. Create a new folder on your computer to store the tutorial files, separated into Part 1 and 2. For Part 1, download the part 1 zip file containing all the datasets you will need for the tutorial to that new Part 1 folder. Finally, extract the files into that folder. For Part 2, do something similar, but download the part 2 zip file instead into that new Part 2 folder, and extract.
To extract a zip file, on a Mac, just double-click on the file to extract its files. On Windows, you should be able to right click and select Extract All... Look at where the files are extracting and click on Browse if you need to adjust it. Then select Extract.
This tutorial is adapted from a MAXQDA 2-Part live workshop series.
Table of Contents
Part 1 - Import/Export, Coding, and Memos
- Create a New Project
- Explore the Interface
- Import Data
- Create Codes
- Code
- Activity 1
- Work with Codes and Activation
- Activity 2
- Create Memos
- Reports
- Activity 3
Part 2 - Document Variables, Queries, Visualizations, Focus Groups, and Survey Data
- Document Variables
- Working with Document Variables
- Document Variable Statistics
- Crosstab
- Segment Matrix
- Activity 1
- Visuals
- Document Portrait
- Document Comparison Chart
- Word Cloud
- Code Matrix Browser
- Code Relations Browser
- Activity 2
- Special Data - Focus Groups and Surveys
- Focus Groups
- Code Line
- Survey Data
Part 1 - Import/Export, Coding, and Memos
Create a New Project
-
Let’s start working with MAXQDA. First start up MAXQDA. I’ll be using version 2 for this tutorial.
-
From the main screen, you will see that there are example projects you can explore to get a feel for MAXQDA. We will look at one of these in part 2 of this tutorial. There are also several links to training and tutorials to learn more.

-
If you’re working on a team and want to keep track of your changes, it is important to set your User name or initials (you can just type something in or select from past entries). But for us, there’s no need to worry about it, so let’s click on the New icon to get started.

-
You must give your project a name, so let’s call it “MAXQDAWorkshop” and choose where we want to save it. It is important that you always make note of where you are saving your project file. This is a file that is now saved locally on your computer. Your file does not LIVE in MAXQDA, it lives on your computer. If you delete it by accident outside of MAXQDA, your work could be lost.

-
Depending on where you save your project file, you may get a warning saying that you’re saving it in a synchronized folder, which is not recommended. This is because if the file tries to sync while MAXQDA is also trying to do something with the file, you could have a conflict that could corrupt the file. Generally, you should save your project file locally on your computer, not in a synced folder, such as a folder that syncs with OneDrive. For this workshop, it doesn’t matter too much, so you can just click on OK if you see the message, and you should be fine in the short term. When working on your own projects, you could also turn off your syncing while working in MAXQDA to further protect from loss. This issue is common to other tools as well, such as NVivo, but MAXQDA is more upfront about what’s happening and warns you.

If you want to make a copy of your project file, you can go to the Home menu, and select Save Project As. If you do save a copy, MAXQDA will then ask you if you want to open this new saved copy and continue working with it. Again, it is very clear about what you’re doing with your files, which is really helpful.

MAXQDA automatically saves all the time, so you don’t have to click on Save, which is nice. MAXQDA also has an automatic backup feature, and it will prompt you when it is time to create a backup. If you click on the Preferences icon at the bottom left of the screen, and then select Automatic Backups, you can see the frequency of the backups (default once a day) and select the folder where you want to store them. You should take a look, so you know where your backup files are in case you need them later. If you do a bunch of work, but then wish you could roll back to earlier point in the project, you will have a backup copy from an earlier date that you could go back to.


Explore the Interface
Let’s briefly look around before we get started.
-
You will see 4 main panels. The top left is the Document System, which is where you will see your imported files and can organize them. The bottom left is the Code System, which is where you will see your codes and can organize them. The top right is the Document Browser, where you will see a preview of the current document so you can read the contents and code it. Finally, the bottom right is the Retrieved Segments, which we will look at a bit later.

-
For now, we can minimize the Retrieved Segments panel to give us some more space. Click on the minimize icon (looks like a horizontal line) at the top left of the panel. You’ll also notice that for any panel, you can pop it out into its own window using the top left icon that looks like an arrow in a box. Click on the icon again to pop it back into the main MAXQDA interface.


Import Data
Okay let’s get started importing in some data so we can start using the tool. We will be using transcripts from interviews and focus groups run for a US data center study.
As I mentioned before, MAXQDA helps you get organized, so before we import in some data, let’s create some folders to organize our data. In MAXQDA, folders are called Document Groups.
-
From the Document System panel, click on the green plus sign icon and select New document group. Change the name to “Interviews” by clicking on the folder named Group 1.

-
Highlight Documents again and then create one more document group called “Focus Groups”.

-
If we go to the Import menu, you can see a variety of data types that you can import into the tool. We’ll be looking at Word documents and PDFs today, but I encourage you to explore these other types on your own, if you’re interested.

-
Click on the Interviews folder to highlight it, and then from the Import menu, select Texts, PDFs, Tables.

-
Browse to the folder called “DCEE Focus Groups and Interviews,” which has all the study files we will look at today.

-
Highlight only the files starting with “Data Center Interview” in the title in our folder by selecting the first one, holding down the Shift key, and then selecting the last one. You should have 7 files highlighted. Then select Open.

-
Let’s do something similar to import in the focus group information. Select the Focus Groups document group on the left. Then select Texts, PDFs, Tables from the Import menu.

-
You should still be in the same folder when you select Browse. This time highlight the files that start with “NYC” in the title. You should have 8 files highlighted – a mix of Word documents and PDFs. Select Open.

-
You will get a message that says that timestamps were found in a document, asking if we want to import the related audio/video file. We don’t have one in this case, but if we did, MAXQDA would then also import that and match the transcript to the audio or video file using the timestamps. For now, click No to all (so we don’t get this prompt for any of the files we’re importing).

-
MAXQDA will also ask you if you want to keep the timestamps in the text. As we’re not matching it to audio or videos files, we can say No, and MAXQDA will automatically remove them.

These files are now all copied into your project file.
You might be wondering why we didn’t select the Transcripts or Focus Group Transcripts options from the Import menu. The Transcripts option would be used if we have audio or video files that go along with the transcripts, and we want MAXQDA to match them up. You noticed it asked us about that, even when we didn’t select that option because we had some timestamps in our files, so it isn’t missed. The Focus Group Transcripts option has some more advanced features that we will look at in Part 2 of this tutorial, so for now we will ignore it. These features can always be applied later after import, so again we aren’t missing anything.

Create Codes
Next let’s move to one of the main tasks MAXQDA is used for: coding. MAXQDA’s bottom left panel is where the code system is displayed. Codes act like containers to hold all the references or segments to that code. As you create codes, they will display in that panel, and you can use that area to create new codes and reorganize your codes.
If you have already decided upon codes ahead of time (following a deductive approach to coding), you can add these codes to MAXQDA and then start using them. Other times, you will be reading your materials in MAXQDA and creating codes as you go (an inductive approach to coding). And sometimes you will do a combination of this, where you have a rough idea of some codes you expect to see, but then new codes might emerge for you as you read through the materials. For this example, let’s try this combo method. First, we will create a few codes that we will use to code our materials, and then I will show you how to create codes on the fly as you are reading.
-
From the Coding System panel on the bottom left, click on the create new code icon to the left of the gear icon at the top of the panel.

-
For the code name, call it “Budget”. You can assign it a colour if you like, otherwise the default colour is blue. In our case, let's pick purple.

-
The code memo section is where you can add a description for your codes, if you like. You can describe them in more detail and give examples of where it would be applied to understand how to use it in coding. We will just leave it blank for now, but it is generally best practice to fill this out. It will help you and your teammates be more consistent in coding, and documenting your thought processes is often a key component of qualitative research. You can always revisit the code memo and add it to it later as well. So, for now let’s select OK. You should now see our new Budget code listed.


-
Repeat these steps to also create a code called “Maintenance” and make it the colour brown. (Make sure to highlight the Codes folder when creating a new code going forward, otherwise, you’ll create a code nested under whatever code you had highlighted. We’ll talk about nesting codes later.) If you make a mistake, you can always hover over a code and select the red x icon to remove it (be careful with this option if you have started coding!). You can do two slow clicks on it to rename it.

Code
-
Now that we have a couple codes, let’s use them to do some coding. To open up one of our imported files, from the Document System panel, go to the Interviews document group and double click on the first interview transcript to open it in MAXQDA. Note: MAXQDA can open a lot of different file types directly in the tool. The files will be open as read-only, meaning you can’t edit them. This is intentional to prevent error. However, if you happen to notice an error you want to correct, you can toggle Editing on using the Pencil toggle at the top left of the Document Browser. Then, you will be able to make changes to the file. You can toggle editing off when you’re done to save the edits.

-
With the file open, you can then read through it and code. Highlight some text you want to code and then drag it to the code in the Code System panel. You can also do it the other way. You can drag the code on to the highlighted text. (Generally, you want the text to match the coding category, but for now, don’t worry if the text doesn’t match, this is just to quickly show you how it works.) You can see a colour-coded coding stripe next to the text you highlighted with the code name, to keep track of what you’ve already coded and how.

-
If you want the text to be highlighted with the stripe colour, click on the ... icon at the top of the coding stripes area and select “Coded segments in code color.” Click OK.


-
You can also set up keyboard shortcuts. If you right click on the Budget code and select Properties. You’ll see a drop-down to select a keyboard shortcut. Let’s try Ctrl+1. Click on Save. Now highlight some text and hit Ctrl and 1 at the same time to code it to Budget.

-
So far we have been coding using our pre-made codes. However, sometimes, something unexpected might come up that you want to create a new code to code it or you might be following an inductive approach to coding. To do this, highlight some text, and then select the icon at the top to Code with a new code (looks like a red circle with a green plus sign, second from left).
.

-
Here you can give it a name, for example, “Teamwork,” pick a colour (let's say orange in this case), and select OK.

-
If you’re going to be creating a lot of new codes, you can go to Open Coding Mode so that anytime you highlight something, it immediately prompts you to create a new code. Click on the icon that looks 3 red circles overlapping, 4 from the left. Try it out by adding a code called Upgrades and use blue grey for its colour.

-
If you start typing a code name that matches a code you already have, it’ll prompt you to use that code instead to help you avoid duplication. Try that by selecting some text and typing in the name of a code you have already.

-
With your code list starting to grow, you might want to sort it, so you can find codes easily. You can right click on the Codes folder and select Sort. You’ll see you have a few options to choose from. For now, let’s select A to Z.


-
Let’s toggle off the open coding now and look at another way to code, especially if you’re more visual or used to coding the manual way with print paper and highlighters. You can use the highlighting tool. First highlight some text. Then click on the red highlighter icon at the top, select Highlight coding: red. Perhaps we can use red to highlight errors we notice in the transcript that we need to check later. This creates a code called red, but we can slow click on it twice to rename it to “RED – Errors to investigate”.


-
Try highlighting something else in red. Now note that if you make a mistake, you can use the undo and redo buttons at the top right or use the normal key commands, of Ctrl + Z to undo, Ctrl + Y to redo. If you hover over the undo icon it gives you a list of the actions you've done, in order, so you know if you hit undo, the item at the top of list will be undone.

-
You can also code the same segment of text with multiple codes. This is often a powerful way to mark up a document for later analysis. Give it a try!

-
So far we have been coding Word documents, but let’s look at the PDFs we imported as well.
-
Go to the Focus Groups document group and open up “NYC Data Center FG1 Questionnaire 7” by double clicking on it. This PDF file has been OCR’ed, meaning you can select text and code it as we have done before. Try it!

-
Now open up “NYC Data Center FG1 Questionnaire 14.” This PDF file has not been OCR’ed, meaning you can’t select the text and code it as we have done before. Instead MAXQDA treats this more like an image. You could instead draw a box to select part of the PDF (especially helpful if you want to highlight a table or image in a PDF). You will then be able to code this part as normal by then dragging it to a particular code. This way of drawing a box around something is also how you would code an image in MAXQDA. Generally, though, it is better to make sure that any PDFs you import into MAXQDA are OCR’ed for ease of coding. (Note: If OCR’ing PDFs is new to you, this guide might help.)

Activity 1
Okay, let’s break here for our first activity.
-
Add the following codes: “Energy Efficiency,” “Water Consumption” and “Memorable Quotes” (you can do this either ahead of time, or try the open coding feature to create these on the fly)
-
Explore coding with those codes
Having some coding done will be important when you move to the next section.
Work with Codes and Activation
Let’s talk more about Codes.
-
First, you can see now there are useful counts associated with our codes to see how many segments have been coded into that code.

-
If you want to see all the segments that you’ve coded with a particular code, this is where the Retrieved Segments panel comes into play. Before we retrieve segments, we need to talk about a powerful feature of MAXQDA called activation. To pull up all the segments we’ve coded in this project to a particular code, let’s say Energy Efficiency, we need to first activate all of our documents in the project. There are a number of ways to activate a document, but the easiest way is, in the Document System panel, click on a small circle to the left of the name of a document. That should highlight the document in purple.


-
Click on the circle again to deactivate it. If we want to activate all the documents in a document group, we could click on the small circle to the left of the document group name. And to activate all the documents in a project, we could click on the small circle to the left of the Documents folder.


-
So, make sure you have all the documents activated, then go to the Code System panel and activate a code that you want to see all the segments for. In our case, let's activate Energy Efficiency. Again, click on the small circle to the left of the name of the code.

-
Finally click on the Retrieved Segments tab at the bottom to maximize the panel again so we can see the results. Here you will see all the snippets of text that were coded to this code from all documents in the project, listing what document it is from below it. It’ll even show you the part of the image you drew a box around, if it corresponds to this code. If you click on a coding stripe of a segment, it’ll show you the document with that segment highlighted, so you can see it in context.


-
You can see that there are circular handles at each end of the quote displayed in the Document Browser panel. You can adjust what is highlighted by dragging those handles. It’ll ask you if you want to adjust the coding, and when you say yes, it will now also be updated in the Retrieved Segments panel.

-
If you later realize that you mistakenly coded something you didn’t mean to code, you can uncode it. Right click on one of the retrieved segments' coding stripe, and then select Delete.

-
If we think a bit more about what we did to get these retrieved segments and how we activated documents and codes, you can start to see how powerful this can be. You can use activation to customize and filter what you see in the Retrieved Segments panel by what documents and codes you have active. Try also activating Budget to also get those segments. Now it is showing retrieved segments for both codes that are activated. Activation comes up in a lot of places in MAXQDA, so it is important to understand the basics of how it works.

-
Now if we want to quickly deactivate all the codes we have activated, we can click on the Reset activations icon next to the Code search box. There’s a similar icon for documents, but for now, let’s just deactivate our codes. That icon also tells you how many documents or codes were activated.

-
Next, let’s look a bit more at our Code System panel. You will notice that all of our codes are top-level or parent codes, meaning we haven’t established a hierarchy, none of our codes are nested under other codes; however, MAXQDA can help you organize your codes in a hierarchical structure. You are often in the end trying to create a hierarchical codes list to group common codes together into broader categories and themes to help make sense of your coding. For example, create a new code and call it Sustainability.

-
You could use this code to group some of your existing codes. For example, drag Energy Efficiency and Water Consumption onto the Sustainability code. Now you can see that they are grouped beneath. Codes beneath another code are called Child Codes or Subcodes.

-
You can use Sustainability as its own broader code now in coding or just keep it as a heading in the hierarchy. Activate Sustainability. You will notice that the child codes are also activated and all the related segments for parent and child codes will show in the Retrieved Segments panel.

-
You might notice that the count of segments for Sustainability still says 0, even though its child codes are associated with segments. Try clicking on the arrow next to Sustainability to collapse the code group. Now you should see the counts aggregated from the child codes.


-
Right click on Sustainability and change its colour to green. You should see a pop-up asking if you want to colour the child codes with the same colour, which can be helpful to see what codes are related, at a glance. Click on Yes to make the change.


-
Finally, sometimes after you’ve done some coding, you may want to merge two or more codes together into one, as they are very similar. Let’s try this with Maintenance and Upgrades. You can do this in MAXQDA by dragging one code on top of another code but keep holding the mouse click down until you see the word Merge appear to the right of the highlighted code and then hover over there to select Merge instead. Let’s do this by dragging Maintenance over to Upgrades, and selecting Merge.

-
This will merge the segments from the code you dragged (Maintenance), into the code you dragged into (Upgrades). It shows that the code is the result of a merge by adding a + sign to the name. If you regret this, you can always undo!

-
So far, we’ve been manually selecting segments to code, but you can use a text search to do some simple autocoding. For example, go to the Analysis menu and select Text Search & Autocode. Choose the first option from the drop-down menu, Text Search & Autocode.

-
You can use this feature to search for words or phrases and then code matching segments. For example, let’s search for the word “infrastructure” and select Find all word forms (lemma list) to find not just infrastructure, but also its plural form, then click on Run search.

-
Here we see a list of results in the Preview column. If we’d like to code these results to a new code called Infrastructure, we can click on the new code icon at the top (looks like a red circle with a green plus sign). We have the option here to code to an existing code or create a new code. Let’s create a new code by selecting Autocode Results with New Code.

-
It will give you a default name that makes it clear this code was created from autocoding. This can be a good reminder. It also auto populates the code memo with details of the text search. In terms of what we code, we can select how much text will be a part of the segment around the word infrastructure. For this example, let’s select sentence to code sentences with the word infrastructure. This option even allows you to specify how many sentences before and after, but in this case, if we keep it at 0 for both, it’ll just code the one sentence with the word. Click on OK.

-
This will automatically create this new code and apply it to the results and tell you how many segments were coded. Click on OK to close the window. Also, close the search results window. Now we have autocoded some of our text to a new code using a text search.


Activity 2
Okay, let’s break again here for a second activity.
-
Play around with activation and the Retrieved Segments panel. Try to retrieve segments with different combinations of documents and codes.
-
Try creating a parent code and adding a couple codes underneath.
-
Try merging two codes that you have coded some segments with. Then try retrieving the newly merged code’s segments to see the result.
-
Try running a Text Search, searching for the word “constraint” and autocode all the results.
-
Use the Retrieved Segments panel to retrieve those newly coded segments.
Create Memos
-
Okay, if you have anything activated, deactivate everything for now, and let’s minimize the Retrieved Segments panel for now. Let’s move on to another use of MAXQDA. You can create different types of comments and memos to capture your thoughts on some text in a file, a file itself, a code, or the project as a whole. Let’s make a note about something that has come up in the text.


-
Open up one of the interview files, highlight some text, right click, and select Insert Memo for Selection.

-
A window should pop up where you can add your thoughts. Type out a note, such as “This is important!” You can also adjust the title of the memo (currently in bold) to whatever you want. We can leave it for now.

-
You can also select from various memo icons at the top to categorize your memos. You can also classify the memo icons by clicking on the gear icon next to Type.

-
Let’s pick the exclamation point icon and label it as Important. When you’re done typing your note and selecting the memo icon, just close the memo to save it. You will see the memo icon next to the text and the memo itself in the margin. If you hover over the icon, you’ll see the note. If you double click on the memo icon, it’ll reopen it so you can edit or add to it.


-
Let’s say instead that you want to make a note about this whole interview file that you had open. Go to the Interviews folder and right click on an interview file. Select Memo.

-
Adjust the title if you wish to say “Interview Memo” and then you can write a detailed memo about that file. Perhaps, for example, this interview was held in poor conditions, such as a noisy coffee shop, that might have influenced what was talked about. You could note that here. Let’s add that important icon again to this memo. You can also summarize the document, if you wanted in the bottom text box, if you’d like, but for now we’ll keep it blank.

-
Once you close the window, the memo is saved and linked to this file. You should see a small memo icon next to the interview in the list. To view the memo, again you can just hover over the icon. Or double click it to edit it.

-
To create a memo about the whole project you can right click on the Documents document group in the Document System panel and select Memo, and write your memo. Perhaps you want to write notes, such as “The project needs to be reviewed”. Once you’re done, you can close it to save. You can view or edit it similar to a Document memo.

-
You can also use memos to describe your codes. You could’ve created a code memo when creating a new code, or you can add a memo to an existing code now. You can also add segments to your code memo to provide representative examples. For example, activate all your documents and the Energy Efficiency code, and then maximize the Retrieved Segments panel to see related segments. Find one that looks like a good example.

-
Next, right click on the Energy Efficiency code and select Memo. Write your memo first to say something like “This code is used to store all references to energy efficiency in the interviews. An example quote: “ Then drag in one of the segments from the Retrieved Segments panel (by dragging its coding stripe) to add it to the memo. It copies the quote and provides the document name and position in the document where it is found. Then save it by closing the window.


-
Finally, to view all the memos you’ve created, you can go to the Memos menu. You can click on All Memos to see a list of all the different types of memos you have in your project on the left. You can click on one to see the contents of the memo on the right. You can use the options at the top to toggle the view on or off displaying that type of memo in the list.


-
You can also select Search in Memos to search for a word or phrase in your memos. You can also create a New Free Memo (not linked to anything in the project) if you want a more free-form document. You can’t code your memos, but if a memo becomes so extensive that you’d like to do that, you can convert it to a document by right clicking on it in the memo list and selecting Convert Memo into a Document.

Reports
-
Once you’ve done your work in MAXQDA, you might also want to export information out. You can export your codebook, which lists your codes and their memos to understand when a code is normally used. Go to the Reports menu at the top and select Codebook.

-
You can see there are a number of options to choose from. In this case, only have Standardize memo fonts, Number codes, and Export code system with frequencies selected. This creates a Word document with this information. Click on OK and choose where to save it. Save it where you can find it with your other workshop files. It should open automatically, and you’ll see it lists your codes in their hierarchy with their segment counts and then shows you each code with its memo.


-
You can also export a document with its coding. Right click on a document that has some coding done, then select Document Options -> Export Document.

-
From the pop-up window, you can select what type of file you want, and if you want to see coded segments and/or memos included. For our example, let’s select a PDF format and Display coded segments. Click on OK and choose where to save it. Save it where you can find it with your other workshop files. It should open automatically, and you will clearly see all your coding in the document.


-
You can also export a larger report about your project. From the Reports menu, select Smart Publisher. Next you select what you want to include in the report. Let’s select all of our codes and Include code memos, then click on Next.


-
Next, we give it a Title and Subtitle. We could add image files and headers and footers if we’d like. Let’s just give it a title, calling it “Project Report”. Let’s also select Quotation Marks and Include list of documents, then click on Next. Here are more options you can play with to include or not, but for now, let’s keep the defaults and click on Finish.


-
You may see a pop-up window just asking you to confirm something in Word. Click on OK and choose where to save it. Save it where you can find it with your other workshop files. If you see Word prompting you to update fields, just say “Yes”. It should then open automatically, so you can see the contents of the report.


-
These reports are all very helpful for writing up your research and for working in teams and sharing work. I encourage to explore the other options you have available to you to learn more.

Activity 3
Okay, let’s break again here for our final activity.
-
Create a new in-document memo, document memo, project memo, and code memo
-
Search in Memos for a word
-
Convert one of your Memos to a Document and try coding it
-
Try playing around with the settings for some of the exports to see the results
Part 2 - Document Variables, Queries, Visualizations, Focus Groups, and Survey Data
Document Variables
-
Let’s start working with MAXQDA. In your downloaded files, I’ve given you a ready-made project based on some of the files and codes we were working with in Part 1. We’re going to continue working on that project now. Double click on the project file called “MAXQDAPart2Project” to open up MAXQDA.

-
So just a reminder, we have some focus groups and interview transcripts, and some codes we’ve been using. The first feature we are going to look at is Document variables. If you have attributes about your documents, you can assign them to your documents. Once this is in place, you can use these attributes to filter your data for segment retrieval, analysis, and visuals. In our case, as an example, we have a number of interview transcripts. When conducting our interviews, we might have also collected demographic or other relevant information about our participants. It would be great to include that in our project file, so we can filter based on that information. If you’re familiar with Cases and Case Classifications in NVivo, this is similar, but in my opinion, much more straightforward and intuitive. Let’s take a look at how this works.
-
If we go to the Variables menu, let’s select List of Document Variables.

-
Here you can see that currently our documents only have a few default variables associated with each document, displayed in a list. Some key ones are the document group or folder that the document is in, the document name, how many segments are coded in the document, and how many memos are associated with the document. If we wanted, we could create a new variable or attribute manually from this window, and then use the Data Editor for Document Variables window to type in the data for that attribute for each document. But in practice, it is much more common and easier to create a spreadsheet of our attributes and upload them.

-
An easy way to get started creating a spreadsheet is to work from a template that you can get from MAXQDA. Close this window and select Data Editor for Document Variables.

-
This displays a table with each document listed in a row, and each variable with information about the document displayed as column headers. To get an Excel template that we can set up, hover over the Export icon on the far right (looks like a red arrow pointing up), select the option to Open as Excel Table. This will prompt you to save your template. Let’s keep the file name as Document Variables, and save it somewhere you can find it. I’ll save mine with my other workshop files.


-
This should open up the file in Excel. It looks exactly like the table displayed in MAXQDA. Now we can add columns to the table and add extra information. For example, if I added a column called Type, I could then fill in the column as appropriate, save the spreadsheet and import it back into MAXQDA.

-
To save us time, we’re going to take a look at a ready-made spreadsheet I’ve prepared based on this spreadsheet that we will use to reimport. Open up InterviewDocumentVariables.xlsx.

-
Here you can see that I’ve added information about the different people who were interviewed – what data centers they manage, last major purchase or upgrade, role level, experience, and size of team. It is important to note that for any additional variables you add, if they contain numbers, make them categorical. For example, I put ranges for size of team instead of a specific number. This makes it easier to work with the variables in various analyses and visualizations. However, it is fine to include non-categorical information here as well, if you just want to compile all your information in one place.

-
Okay let’s import this back into MAXQDA to create additional document variables. Close the spreadsheet and go back to MAXQDA. You should still have the Document Variables window open. If you don’t, just select Data Editor for Document Variables from the Variables menu to reopen it.

-
Click on the import icon (looks like a green arrow pointing downwards) above the table.

-
Choose the InterviewDocumentVariables.xlsx file and click on Open.

-
MAXQDA will display the variables to import. It also tries to detect what type of variable it is – numbers, text, etc. and display that in the Target column. All of our new variables are text variables, so we can keep the defaults as it has detected the type correctly. So click on the Import button.

-
Now you can see that our information has been added to the table for the Interviews. We didn’t add information for the Focus Groups here, so they are not updated. Close the window.

Working with Document Variables
-
Once your document variables are added, there are a lot of options opened up to you in terms of viewing and working with your data.
-
One thing you can use document variables for is to activate a document based on an attribute. For example, let’s say we want to retrieve all the segments where executives talked about energy efficiency. First, we need to activate the interview where the interviewee is an executive. Go to the Mixed Methods menu and select Activate Documents Based on Variables Values.

-
Double click on Role Level from the list on the left (or highlight it and click on the right arrow key) to put it in the Conditions column.

-
From the Value drop-down menu, select Executive. It tells you how many documents will be activated at the bottom - in this case 3. Click on Activate. You will now see the appropriate 3 documents activated that are associated with Executives.


-
Then activate Energy Efficiency by clicking on the circle to the left of it in the Code System panel.

-
If you bring up the Retrieved Segments window, you will now see all the segments that are coded energy efficiency, from executive interviews only.

-
Another way to use your document variables, is to understand your documents better. For example, you can look at simple descriptive statistics of your variables. Before we do this, let’s deactivate any documents and codes you have active by clicking on the reset activations icon at the top of the Document System Panel and Code System Panel (looks like a purple tag icon with a number).

Document Variable Statistics
-
Next, from the Variables menu, select Document Variable Statistics.

-
From the list on the left, double click on Experience to select it or use the right arrow button, then click on OK.


-
This table shows you how many documents fall into these categories of experience. Click on the chart icon on the top left to see these results visualized. This can give us a sense of our interview participants experience.

-
You can customize this graph. For example, click on the horizontal bar graph icon on the far left to change the display.

-
Click on the four square colours icon just above the graph to change the colours of the bar. Select a colour palette of your choice.


-
You can also change the labelling. Click on the number sign icon at the top left to toggle it off, so now the bars are only labelled by their percentages.

-
Finally, we can export this bar graph as an PNG or SVG image file by click on the export icon at the far top right (looks like a red arrow pointing up). Choose where to save your file, leave it as a PNG file, and click on Save. Then close the Document Variable Statistics window. Note: This export icon option is available in the same location for all the visuals and other outputs discussed in the tutorial.


Crosstab
-
We can also use document variables in our analysis tools. For example, let’s look at the Crosstab. Go to the Mixed Methods menu and select Crosstab.

-
Double click on Role Level from the list on the left (or highlight it and click on the right arrow key) to put it in the Conditions column.

-
From the Value drop-down menu, select Executive.

-
Repeat this to add Role Level again to the Conditions column, but this time select Manager from the drop-down menu. Then click OK.

-
You will be presented with a table where the rows are your codes and the columns are your selected document variable values. The cell values are how many segments intersect between role and code – for example, you can see that according to our coding, only Executives mentioned anything to do with maintenance.

-
At the top are various icons you can use to customize the table. For example, click on the background colour icon (looks like 3 small green boxes in a square). The darker the shading, the larger the number. Also, click on the Sigma sign to add row and column totals.


-
Currently it is displaying the number of segments, but we can change that to row percentages (to compare a code across Role Levels) or column percentages (to compare a Role Level across codes), by using the right arrow and down arrow icons. For example, using the row percentages, we can see that Managers spoke quite a bit more about Upgrades than Executives. You’ll notice that if you have row percentages selected, the percentages in a row will add up to 100% (and similar if you have columns selected).


-
It shows you at the bottom of the table how many documents fall into each category. If we had a lot more data for one category than another, this could influence the numbers to be higher for that category, so you can’t always take these numbers as clear indicators. Often we aren’t reporting these numbers but use them to notice trends in our data that we might want to explore more.

-
If you double click on any cell, it will bring up those segments (at that intersection of code and variable) in the Retrieved Segments window.

-
For results of any analysis, we can export it. In this case, we could export this table as a spreadsheet by clicking on the export icon at the far right (looks like a red arrow pointing up) or the shortcut Excel icon. Choose where to save it. It creates a spreadsheet of this table and retains the cell shading.

Segment Matrix
-
From the Crosstab, we can also move to a related analysis tool called Segment Matrix. This tool can be selected from the Mixed Methods menu, but if we want to keep the same codes and variables, we can just go to it from the Crosstab display by clicking on the far left icon, called Segment Matrix.


-
Our codes are now listed on the left and the first code is highlighted. The columns on the right pertain to the variable values we’ve selected from the Crosstab. Underneath it displays all the segments that intersect with that code and variable value, and you can compare them between the variable values for a particular code. You can select the different codes in the list to view those appropriate segments. A great way to compare your data.

-
You can use the export icon to export this as a Word or Excel file.

Activity 1
Okay, let’s break here for our first activity.
Remember that between each step in this activity, you may need to reset your activations.
-
Bring up Retrieved Segments for segments coded as Upgrades where the interview has 16-20 years of experience. (When activating documents by variable, click on the red X icon at the top of the conditions column to clear the list and start fresh).
-
Create a horizontal bar graph visualizing interview documents by size of team and export it.
-
Create a Crosstab with the experience variables along the top. Again, you should clear the Columns list before proceeding by clicking on the red x at the top. (Quick tip, instead of having to choose each value for a variable, you can check the option that says Insert all variable values as conditions). Change it to calculate row percentages and turn on cell shading. Export it as an Excel spreadsheet.
-
From the Crosstab, go directly to the Segment Matrix. Explore the matrix and then export it as a Word document.
Visuals
MAXQDA is really strong in its visual tools. We won’t be able to look at all of them today, but I’ll show you a few to get started. A lot of the visuals will use your code colours, so generally make sure that you assign colours that make sense to you.
- For this part of the workshop, we’re going to look at one of the example projects so that we have more data to visualize.
-
Go to the Home menu and select Open Project. Hover over Example Projects and select ENG/Work Life Balance.mqda. This is a complex project that includes interviews, focus groups, images, survey data, and more. I encourage you to explore this project on your own time later to learn more about MAXQDA.

Document Portrait
- For now, the first the visual to take a look at is the document portrait. This gives you a sense of how much coding you’ve done in a document, what codes dominate and where, etc.
-
Expand the Interviews folder, and then expand the Berlin folder, and right click on Chris. Select Document Portrait. The coloured squares represent how much coding of the different coloured codes have been applied to this document and in what order.


- As we aren’t too familiar yet with the codes in this project, you can turn on a legend by clicking on the legend icon at the top (looks like 3 coloured boxes with lines next to them). We can see for example that there are more positive than negative statements in this interview.

-
Currently it is just showing the code colours continuously, but we can the visualize entire document by clicking on the icon at the top left to see gaps where no coding has been done. This can give us a sense of how complete our coding is on this document.

- Just like with other analyses or visuals, we can export this, if we wanted. For now, let’s close the window.

Document Comparison Chart
- Another interesting visual that is in a way similar to document portrait is the Document Comparison Chart, which compares the coding in multiple documents instead of just one.
-
First, I’m going to activate all the Interviews from Berlin to compare them, by clicking on the circle to the left of the Berlin folder. This activates everything in the folder.

- Next, go to the Visual Tools menu and select Document Comparison Chart.

-
Make sure that Only for activated documents is checked, then click on OK.

-
This visual allows you to compare essentially Document Portraits for different documents. This works particularly well for structured documents that have the same number of paragraphs and allow for a direct comparison. Click on the icon at the top left to standardize the document lengths to help with comparisons.
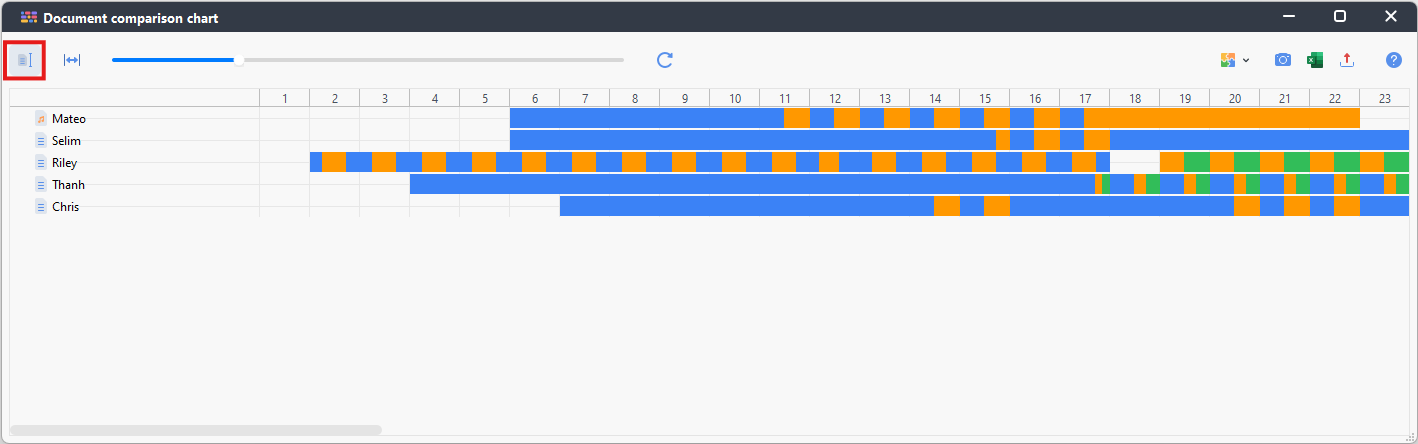
-
You can also click on the icon to the right of that, to fit the display to the window to see the whole visual at a glance, without needing to scroll.
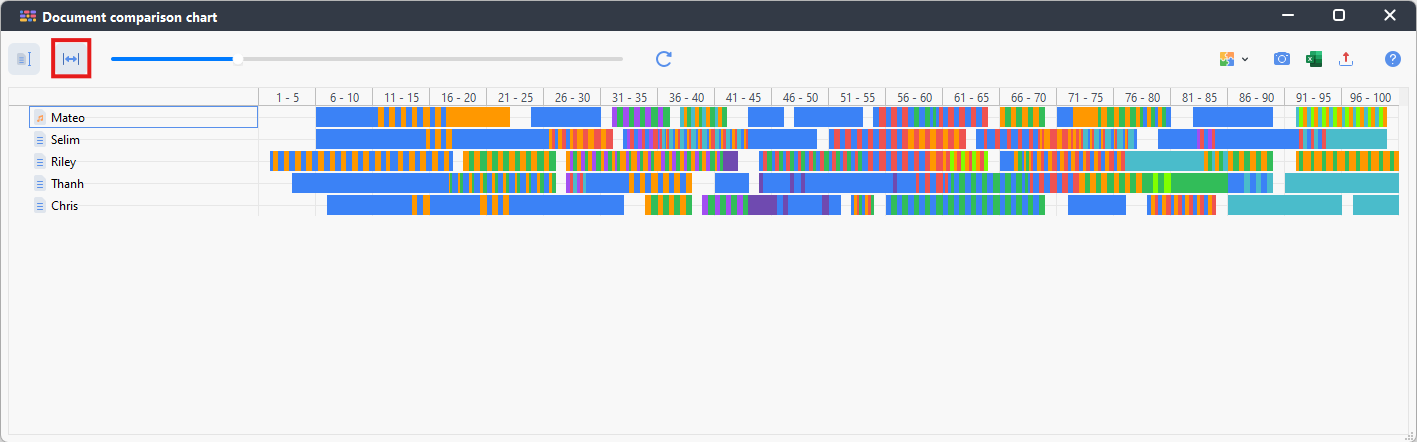
- Again, we can export this, if we wanted. Look at the differences, for example, in how much negative or positive coding there is compared to each document or where in the interviews do most people start getting negative. For now, let’s close the window.

Word Cloud
- The third visual we will look at are word clouds, which shows the most common words in one or more documents, displaying the word larger if it is more frequent. It is often a good visualization to do early on in a project to get a sense of key topics in the data. Go to the Visual Tools menu and select Word Cloud.

-
First, we have to either drag documents that we want to build a word cloud from, or we can activate documents and then click on Insert activated elements. Let’s try the second way as we already have some documents activated from the last example. Click on Insert activated elements. Then click on OK.


-
Here is your word cloud showing you the most common words. For word clouds it is always best to apply a stop word list of words to ignore. A stop word list contains really common words that wouldn’t be useful to analysis. For English, that would be words like “a,” “the,” “and,” etc. To apply a stop word list here, click on Apply Stop Word List at the top. The first time you do this, you might have to pick English to get the English stop words.

-
You will also want to select Base Form (Lemmatize) and select English as the language. This will group a base word together with all of its endings – such as run, runs, and running.

-
If you click on Word Types: All, you will see that you have options to select a certain type of word, like Noun, to further customize your word cloud in powerful ways. We’ll leave it for now by clicking on Cancel.


-
The Format tab provides you with options to change the shape, colour, or alignment of words in your cloud.

-
If you double click on a word in the cloud, it’ll bring up a table with all the references to the word in context.

- And finally, again, we can export this, if we wanted. For now, let’s close the window.

Code Matrix Browser
-
With our Berlin interview documents activated, let’s look at another visual called the Code Matrix Browser. This compares documents to codes. We have our documents activated, but this time, let’s also activate some codes.

-
Go to the Code System panel and activate all the Daily activities codes by clicking on the circle to the left of Daily activities. You can expand the code to verify that all the child codes have also been activated.

- Go to the Visual Tools menu and select Code Matrix Browser.

-
Make sure that Only for activated documents and Only for activated codes are both selected. Click on OK.

-
Here we are presented with a grid where the documents are along the columns, the rows are our codes, and the cells show as different sized squares to represent the number of coded segments that are coded with a particular code from that particular document. The larger the square, the larger the number. This can show you the most frequent codes used in particular documents.

-
We can change the squares into shaded numbers instead by clicking on the Display heatmap with values icon at the top (looks like 1 and 3 displayed in front of shaded boxes).

-
We can also change it from numbers to percentages by clicking on the Display heatmap with percentages icon at the top (of the red and blue icons, it is the farthest to the right).

-
Similar to the Crosstab we created earlier, we can change it to calculate column percentages or row percentages by clicking on the icon with green vertical or horizontal lines. Column percentages will show the percentage of all coded segments in a document, how do they map to the codes. Row percentages will show you the percentage of all segments in a code and how they map to each document.


-
As with Crosstabs, if you double click on any cell, it will bring up those segments (at that intersection of code and document) in the Retrieved Segments window.

- And finally, again, we can export this, if we wanted. For now, let’s close the window.

Code Relations Browser
- One more visual that is similar to the code matrix browser, is the code relations browser.
- The difference is that the columns and rows are both a selection of codes to see where segments have been coded with more than one code and what are the most common intersections.
- Go to the Visual Tools menu and select Code Relations Browser.

-
We want to examine the Daily activities code and all its child codes. So, make sure they are activated, then select Activated codes, under Rows.


-
Under Columns, next to Select codes, click on the ... button. Let’s select the child codes negative and positive under Satisfaction. Click on OK.


-
Keep the rest of the defaults for now and click on OK.

-
Now we get a similar grid to the Code Matrix Browser, but showing code intersections. Again, you can change the settings using the icons at the top. We can see for example that there were a number of negative segments referring to Friends & Family. We can double click on that cell/square to see the examples in the Retrieved Segments panel to explore this further.

- And finally, again, we can export this, if we wanted. For now, let’s close the window.

Activity 2
Okay, let’s break again here for a second activity.
-
Create a Document Portrait for Riley and export it
-
Create a Document Comparison Chart for the Hamburg interviews. Normalize document length, fit to window, and export it
-
Create a Word Cloud for the Hamburg interviews that only includes nouns as the Word Type. Make sure that you have selected Apply Stop Word List. Try playing around with colours and other format settings and then export it
-
Use the Code Matrix Browser to compare Hamburg Interviews and Working conditions codes. Display a heat map of row percentages and export it
-
Use the Code Relations Browser to compare Working conditions codes with Satisfaction child codes negative and positive. Display a heat map of row values and export it
Special Data - Focus Groups and Survey Data
Focus Groups
-
Finally, let’s talk about two common types of data, and some of MAXQDA’s special features to help analyze them. For this, we need to go back to our other project file that we were working on at the beginning of the workshop. Go to the Home menu and select Open Project. You should see a list of recently opened projects, including our “MAXQDAPart2Project” file in the list. Select it.

- Okay we’re ready to get started. The first one to look at is Focus Group transcripts. We actually already have one in this project file called “NYC Data Center FG1 Transcript.” Double click on that to open it up in the Document Browser panel.

-
You can see that to denote who is speaking in the transcript, we have all cap labels, such as MOD, MALE, MALE2, and FEMALE. When you have transcripts where you might want to isolate what someone has said, or exclude what the interviewer or moderator has said, you might want to use the Focus Group functionality in MAXQDA. Just to note, this will also work on our interview transcripts as well.

-
If you were in Part 1 of the workshop, you might recall that we imported these Word documents from the Import menu using the Texts, PDFs, Tables option. Instead we could have used the Focus Group Transcripts option from the Import menu. If you click on the drop-down arrow for that option, you will see that MAXQDA can bring in transcripts from a number of tools and will understand their formatting. This is actually a great list to see transcription tool options! The first two items in the list are when your tool isn’t listed or you did your transcription manually. You have the option to select with or without timestamps. When you import something with timestamps, it will also ask for the associated audio or video file and match the two together. In our case, we only have text transcripts, so we don’t need to worry about that.

- As we’ve already imported in the file as a regular text file, we don’t need to reimport it using the Focus Group Transcripts options. Instead, with our focus group transcript highlighted in the Document System panel, we can just select Convert Text to Focus Group Transcript from the Import menu (the option is to the far right on the menu), and then select Convert Displayed Document.

-
Here MAXQDA shows us a table where it has identified all the unique speakers in the document. It was confused by the title and transcriptionist’s note and picked those up as speakers as well, but we can deselect the first two items to ignore those during the conversion.

-
Also, click on the code color icons to set unique colours for each speaker that make sense to you. Then click on Convert.

-
You’ll see that the document’s icon has changed in the Document System panel and now you can expand it to see a listing for each speaker. If you look at the Document Browser with the transcript open, you will see that the content has now been coded by these special focus group speaker codes. These codes also show up in a special section in the Code System panel.

-
Now you can use these special documents and codes to filter your data. For example, activate the FG1 document in the Document System panel. And then activate the FEMALE code in the Code System panel. If we open up the Retrieved Segments panel, we can see only statements made by the FEMALE participant in that focus group.


-
Now let’s say that you want to only see what the FEMALE participant has said about Energy Efficiency specifically. You might think that you should activate Energy Efficiency from the Code System panel, but this then just adds all of the Energy Efficiency segments to the Retrieved Segments panel. You can see that the segment count increased from 69 to 73.


-
Instead, if you want the intersection of the two, activate only the FEMALE document in the Document System panel and only Energy Efficiency in the Code System Panel. Now you should see only the three segments from the FEMALE participant that were coded with Energy Efficiency.


Code Line
-
Finally, a visual tool that can help you analyze focus groups is Code Line. Activate all the Focus Group Speaker Codes for FG1 from the Code System panel by clicking on the circle to the right of the focus group document name below Focus Group Speakers.

-
Go to the Visual Tools menu and select Codeline.

-
Make sure that Only for activated codes is selected.

-
Here is a visual showing how each participant contributed to the conversation. Click on the standardize unit width icon (second from the left) and, to view the whole document in the window, click on the Fit to Window Width icon (looks like a double-headed arrow) at the top.

- It gives you an interesting overview of how the focus group went. Here you can see for example that MALE2 did not contribute much to the conversation, while MALE seems to have dominated it.
- You can learn more in the MAXQDA manual, Analyzing Focus Group Data Section.
- Let’s close up that window now and move on to our second topic.

Survey Data
-
The second special data type we’re going to look at is Survey data. As part of the download package, I provided you with an Excel file called SurveyData.xlsx. This is a Survey of Millennials on their thoughts about work from a database called Kaggle. Let’s open it up and take a look. You’ll see that in the data tab, each row is a participant and their responses. Each column is a code that corresponds with a question in the survey. To see how the codes and questions match up, you could look at the questions tab.


-
Okay, let’s import this Excel file in. Close Excel and go back to MAXQDA. Highlight the Documents folder. Then go to the Import menu and select Survey Data. You’ll see that you are able to import survey data from Excel, Survey Monkey, and SPSS. For us, we need to select Import Data from Excel Spreadsheet.

-
Browse to the SurveyData excel file and click on Open.

- The first screen just asks you to rename the survey, if needed, before proceeding. That name will be the name of the document group that will store all the survey responses. It also provides a preview of the data. We can keep the name as is, then click on Next.

- You then have to go through and identify which questions are closed-ended questions (those questions should have quantitative selected), and which questions are open-ended questions (those questions should have qualitative selected). Unfortunately, you need to do this manually, as it often has issues detecting the questions correctly. In our case the first few questions are all closed ended. All the rest are open-ended questions, starting with the MaQ1 to the end. To select them quickly, you can use the toggle boxes for qualitative and quantitative. First click on the boxes beneath qualitative and quantitative until all check boxes are cleared. Then click on the box beneath qualitative to select qualitative for all items. Then manually deselect qualitative for the closed-ended questions and instead select quantitative. When you’re done you should have quantitative selected for the closed-ended questions and qualitative selected for the open-ended questions. For the quantitative variables, it also detects the type of data, Boolean, text, etc. Make sure that these are also correct. In our case, it all looks good, so click on Next.

- The next screen asks how to name your cases and whether to group them into folders. We can use the column Sr No as our Case IDs, which should be selected automatically. We don’t want any grouping, so we can leave that blank. Finally, we can click on Import.

-
A window will pop-up to tell you that the survey imported successfully. You should have one document for each survey respondent, all grouped together in a New Document Group, SurveyData. Each document lists all the open-ended question responses for that survey respondent. For now, we can click on OK.


-
Along with creating documents, it also creates a code for each survey open-ended question’s responses, under a Parent Code, which is the same name as the document group, in this case, SurveyData.

-
Another window should also open up automatically, which is the Survey Analysis window. On the left, it lists our survey questions. If you click on a closed-ended question, such as Industry, it will display a bar graph of the various responses to this question.


- If you click on an open-ended question on the left, it will display the responses in the centre panel to that question, and on the right, it will display the new code system for our questions. For example, click on MaQ3.

-
Now we can use the code system on the right to create new codes we can use to code our data. For example, if you hover over MaQ3 parent code, click on the green plus sign and create a new subcode called Flexibility. Do that one more time to create another subcode called Risk Taking. Then try coding some of the responses to those codes. You can now see the codes listed to the right of the responses in the centre panel. If you hover over a code there, you can click on the X to remove that code being applied to that response if you make a mistake.


-
You can also do a text and search autocode as we've done with other documents. Select question MaQ6 on the left.

-
Click on search Search & Autocode, search for WhatsApp, and click on Run search.


-
You should have two results. You can create a new code and code these items by clicking on the coding icon just above the responses (looks like a red circle with a green plus sign).

- You can choose to code entire responses, paragraphs, sentences, or just the search hit. In our case, let’s code responses (as the responses are short). Select Autocode Responses Containing Search Hits.

-
A new code pop-up window should appear. Click on OK to keep the defaults.

-
Now your responses are coded with the new code. Click on the X above the search results to go back to seeing all the responses for this question.

-
Finally, we can use a tool to analyze sentiment of responses. Select MaQ1 on the left.

- Select Analyze Sentiments from the top ribbon menu. It will create additional columns next to the responses and assign a sentiment for each response looking for positive and negative words.

-
The Analyze Sentiments window will open. Select Apply stop word list (English) and then click OK.

-
You should always read through the results to see if you agree with the sentiment assigned. If we're happy with the sentiment, we can have it autocode the responses. Click on Autocode Response with Sentiment. Keep the defaults and click OK.


-
New codes have been added. If we click on the Codes column heading, we can sort the coding together. Take a look at the Negative codes. We see that [No response] has been grouped under there, when we might prefer to have it coded as No sentiment. Hover over the Negative code for each [No response] entry and click on the red X to remove the Negative coding for those entries.


-
Then select all 8 [No response] entries and drag them over to the No sentiment code on the right. You can now see them all categorized as No sentiment if you scroll down. This kind of sentiment analysis can work really well on simple responses to a question that asks for an opinion. But it is always good to read through the results to see how accurate the coding has been.


-
You can learn more in the MAXQDA manual, Analyzing Surveys section.
That’s it for today! For more information, see our MAXQDA Guide.